
As expected by the majority of economists, home loan approvals continued to fall in April making it the seventh straight monthly decline. April recorded a 2.8 percent fall for owner-occupied finance commitments. The last time we saw numbers this weak was in March 2001.
We normally publish our own charts like the one last month, Mortgage approvals plunge to nine year lows showing a link between mortgage approvals (demand) and house prices. However the Sydney Morning Herald has done a wonderful job today with this graph :
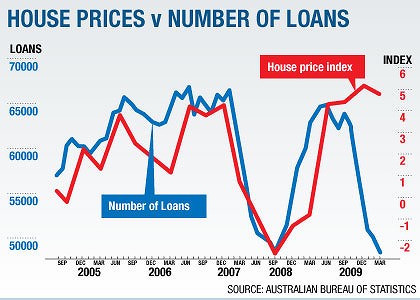
As you can see, there is a close correlation between mortgage approvals and house prices. As the majority of people require housing loans to be able to purchase a home, when mortgage approvals fall, the soft demand results in house prices cooling.
However, this time it appears to be different. When the housing market started to show signs of weakness, Wayne Swan opened up our property market to foreign buyers. It was those foreign buyers, using cash or loans from their home countries that propped up our house prices, causing a large divergence between mortgage approvals and house prices. Some agents were reporting as many as 30% of purchases were to foreign buyers, which as you can see, helps counteract a fall in house prices from the shortfall of mortgage approvals.
In late April and under immense pressure from the public, the government reversed their decision on streamlining foreign property purchases, effectively turning off the tap overnight. Housing statistics take a while to come through the pipeline, and potentially we could be in for quite a shock soon. Already we are witnessing rapidly falling clearance rates.
» 5609.0 – Housing Finance, Australia, Apr 2010 – The Australian Bureau of Statistics, 9th June 2010.
The graph is interesting, but let’s apply some critical thinking. Why is the time frame so short? What happened before 2005? The data is probably on the ABS site? It would be interesting to see the chart plotted over a longer time frame, say 30 years? Or, is the data not available for that long?
It is interesting to note though, that the MSM is now running sensational bubble stories which has not happened in a long time. This will definitely affect the market as a negative mood will start to slow the market down.
The Rudd Government is more guilty of interfereing in the housing market then the Howard government!!.
Now that Glenn Stevens has warned us to lock our stable doors as the horse has well and truly bolted, we can rest assured the inevitable has arrived for all Australia’s wannabe Donald Trumps.
This chart shows a classic price skew to the upside as the bottom and midrange buyers exit the market. This is the same skew that occurred when the US and UK property markets tipped. China’s tightening has sounded the knell for Aus’s bloated housing prices.
Personally, I can’t wait to see native Australians be able to afford their own land again. Of course, this has been fought tooth and nail by one rapacious banking regime after another, aided by a corrupt and short-sighted government that, in common with other western economies, has cannibalised its middle class. When Australia decides to build up our middle class again, then it will (for real this time) be ‘time to buy’. We will know it is ‘time to buy’ when house prices are LOW, not bloated with speculative get-rich fantasies, realtor frills, taxes, and other price paddings that the innocuous phrase ‘unaffordable mortgage’ covers. Before that happens, I expect to see our government once again try to sell off our residential land to the Chinese as our own citizens sink further into insolvency.
I am heartily sick of seeing our nation of debt slaves hoodwinked into their own poverty, over and over again. This fall in loan approvals is the best news I’ve heard for a long time. But I expect our corporate-owned media will spin it as ‘bad news’ to their indebted audience, long on fantasy and short on math.
PS: I must add that if it requires debt to ‘afford’, then the price is not LOW, no matter what a debt pedlar insists. I do expect to wait awhile as there are a lot of property speculators here and in China who will have to go bust first – but, within this decade, people will become once again accustomed to counting debt as the opposite of income. We have been brainwashed by three decades of falling wages, rising debt, and fiddled inflation stats; thank God this brainwashing is at last reaching its end. It may surprise some ‘homeowners’ to discover that they are, in fact, speculators; and who in fact does own ‘their’ home.
Peter, we have published a graph with a longer time scale for the past 6 months. It can be viewed from :
http://www.whocrashedtheeconomy.com/HousePricesVsMortgageApprovals_Mar2010.gif
You asked what happened before 2005? Yes, in 2003 when mortgage applications fell, so did house prices.
Interesting website, rich with data (if a little bit selective towards the bearish).
Do you have – or are you able to point me towards – any long term data on the numbers of houses available for sale at a given time? Auction numbers are sometimes quoted, but it seems to me the auctions:listings ratio is cyclic.
I’m interested because I want to test a theory of mine, which predicts that the ratio of {houses for sale} to {houses on the ground} would have declined in recent years. If it hasn’t declined, then my theory is cactus.
The theory goes something like this. In the mid-90s, a new property cycle after the previous crash takes off, but instead of flattening a few years later as usual, it catches an unusual wave of positive-feedback tax distortions, causing it to develop into a bubble.
No, not negative gearing, that’s been around for donkey’s years without causing house prices to depart very far from the inflation rate. The two tax changes are GST and Capital Gains Tax.
GST, because it favours second-hand homes and deters the building of new homes, a point which is both acknowledged and conspicuously avoided by the first home owners boost.
Capital Gains Tax, because it affects every appreciating asset class except dwellings – either because
(a) the owner is the occupier, or
(b) more and more investors realize their capital gain not by selling, but by reborrowing at a higher valuation
– both situations being exempted from the Capital Gains Tax.
The resulting accumulation of a higher and higher proportion of properties in the hands of buy-and-hold investors – taking them permanently out of the turnover pool – constricts supply and raises prices.
This in turn leads to more reborrowing by homeowners, voters focussed sharply on house prices, pro-cyclic government policies, buyers afraid of missing out, and so on … in other words, a bubble.
As I said, it’s only a theory, and it needs data to test it. A rise in the proportion of investment houses would not, by itself, confirm the theory. Only a rise in the number of buy-and-hold-permanently investment houses would confirm it. The best indication of that, that I can think of, would be a decline in the proportion of houses-for-sale to houses-on-the-ground.
Can anyone help with those data?
Oops, I forgot to state the hypothesis. The hypothesis is that the second Capital Gains Tax exemption I mentioned above – in which the act of reborrowing at a higher valuation does not count as a Capital Gains Event – is a major cause of depressed affordability, and that closing that loophole would bring on a significant correction.
Hmm, you’ve got some good points there. I always thought that it was NG that allowed Investors to keep acquiring properties but if it is as you say the culprit is the Capital Gains tax on Investment Properties and the incompetent government policies that enforce them.
Hi Admin,
Thanks for the link. I’ve actually seen that before (here) but forgot about it 🙁 Any chance of adding the latest data to it and posting it again?
It is interesting how the MSM graph cuts off five years.
It is irrelevant how many immigrants come to Australia or how much our population grows. The law of supply and demand will dictate whether prices go up or down (without government manipulation). And ‘demand’ should be ‘demand of those who can afford housing’ not the ‘demand of those who want housing’. Because in the end we all want our own home but this should not be used to confuse the real situation.
So we have more homeless people and working families living out of cars?
Anybody who has a job has no excuse to be living in cars.
is that single full time, dinks or like the single mother I saw in the paper yesterday, who works part-time whilst raising 2 children from the back of her car?