
You could be mistaken for thinking we didn’t each have a part to play in the Global Financial Crisis. It wasn’t that long ago Kevin Rudd was saying “As Prime Minister I will not sit idly by and watch Australian households suffer the worst effects of a global crisis we did not create.”
But the cause is closer to home than we think.
The Great House Bubble
Despite real estate agents and industry lobbyists shamelessly spreading the concept that house prices double every 7 to 10 years, sadly this is nothing but lies. But as they say there is "truth in marketing" and you certainly can’t say they haven’t marketed Real Estate well – just too well, and now we are paying the costs.
House prices in fact, do not increase in the long term faster than inflation. Historically, you don’t buy houses for capital appreciation, but rather rental yield.
The chart above shows over 100 years of "Real" house prices, that is, prices corrected for inflation. Both the United States and Australia is featured. As you can see, over the long term house prices don’t really do anything.
What happens from the late 1990’s onwards in enough to scare anyone.
The driver of this bubble is still open for debate. After tech wreck the U.S. Federal Reserve dropped interest rates quite sharply. Rates didn’t drop nearly as much in Australia and our boom appeared to start some ten years earlier, so while some analysts suggest low interest rates were the cause, the jury is still out. What is more concerning is the implications.
Implication of Rising Housing Costs
Now what are the implications of rising housing costs? I use the term rising housing costs as this covers both mortgage repayments and rents. As the first part of this crisis developed, it was rising housing asset prices and associated mortgage repayments having an effect on household budgets.
During the later part of the crisis, landlords decided to increase rents at a pace which far exceeded wage growth, hence the same repercussions shifted into rental households and remain a real threat today.
Household Debt
Money doesn’t grow on trees, so as house prices continued to accelerate, homeowners needed to borrow more. It doesn’t take a highly educated economist from the treasury to work out that household debt must go up.
If you look closely at the real house prices for Australia, you will see the first part of the housing boom started in the late 1980’s and never fully corrected. This is the same time household debt started to adjust its trajectory for the moon.
In the 1980’s for every dollar earned, the average Australian household had about 40 cents of debt. By the time household debt reached orbit in 2008, the average Australian had debts totaling a fraction less than $1.60 for every dollar they earned.
Household Savings
Just as household debt skyrocketed, household net savings went through the floor. In the 1980’s Australia was a nation of savers, putting about 10% of household income under the pillow for a rainy day.
By 2002, the average Australian household was actually spending more than they earned and household net savings went negative. This continued for a number of years.
Mortgage Repayments
Unfortunately there is no free lunch in life. As house prices went up and along with it debt levels, so did mortgage repayments. Below is a graph of interest payable on dwellings as a percentage of household net income.
The figures represent the aggregate of all Australians, hence why the figures appear low. But it’s not the actual values that are of interest, but the step rise from 2001 to 2008. Payments shot up from under 4% to over 10%, a rise of 150%.
Household expenditure
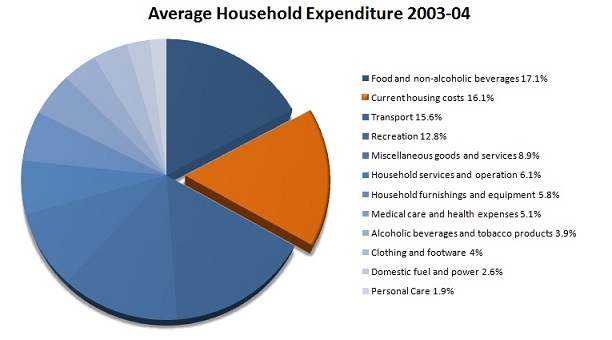
The following chart shows the Average Household Expenditure for 03/04 financial year taken from the ABS Household Expenditure Survey (6530.0). In 2003/04 the largest household expense was food and non-alcoholic beverages, followed closely by housing costs. The housing cost category includes rents, rates and interest payments on mortgages.
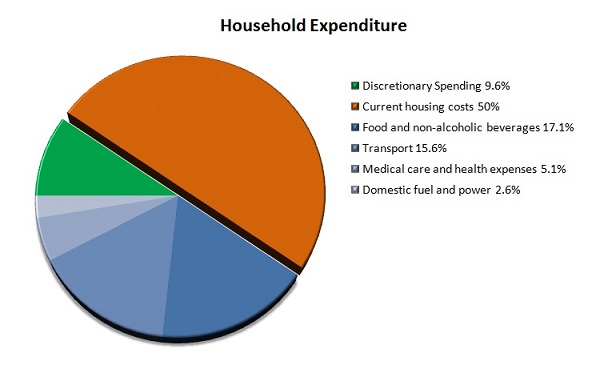
Below is another chart for the same year – 2003/04. What we have done is simplified the chart by grouping some of the categories into discretionary spending, that is spending that we have some choice on, like recreation, miscellaneous goods and services, household furnishings and equipment, alcoholic beverages and tobacco products, clothing and footwear and personal care.
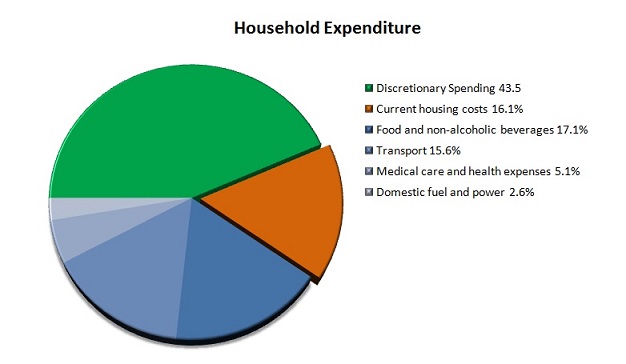
This leaves categories such transport, medical care and health expenses and domestic light and power as necessary services. You could argue that if need be, you could leave the car at home and take public transport, cancel your private health insurance and live in the dark, but you get the picture.
Remember by 2003 we were actually spending more than we earned. Now as much as we would like it to, money doesn’t grow on trees and the average working family has probably eroded any savings by now. If house prices rise faster than household income, like has been the case for the past decade, something must budge in the household budget.
Let’s increase housing expenses. We have already decided there are some fixed expenses in our budget which will not change (not really true, both petrol (transport) and private health insurance premiums have gone up more than inflation).
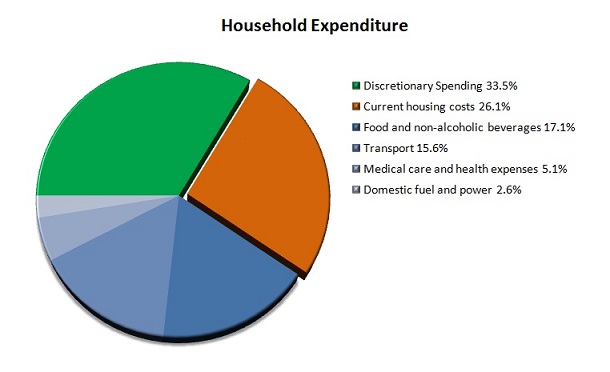
So what budges in the budget? Discretionary Spending.
It simply means as housing expenses continue to outpace household income, households must cut back on discretionary spending.
Now let’s fast forward a couple more years and with rapidly rising house prices, let’s make housing costs 50% of the household budget. Now, don’t laugh. Housing stress is considered when the household spends more than 30% of income on housing expenses. Many new buyers took out 100% loans, so it’s not unreasonable for more recent purchasers to be paying this, if not more.
In a recent Melbourne Institute study, it was found in the “mining boom state”, 18% of Western Australians paid between 26% and 50% of their income in debt repayments. These figures were for March 2009, after rates have been cut by more than half, but it would be fair to say than many households have chosen to keep paying down debt at the old rate of payment.
Rising housing costs strangle discretionary spending and the broader economy
So it should now be easy to visualise the repercussions of house prices outpacing household income growth year in, year out for a decade, and why historically house prices only increase in line with inflation or wage growth in the long term. Australia is not alone. Most OECD countries were caught up in this bubble.
But why hasn’t the effects of this been felt earlier?
As house prices increased in the early part of the cycle, we saw household savings deteriorate. Temporary relief was sought by channeling money that would otherwise be spent i.e. the 10% of the household income, into housing.
After 2002, the net savings ratio went negative. So rather than cut back on discretionary spending to make the household budget balance, we started using debt as a means to continue our spending excesses.
Then there is a phenomenon called the wealth effect. As house prices rose, those owners felt wealthy and had a tendency to spend more. In reality, the capital gain is not realised until you sell the asset at a price agreed between you and the buyer. Before then, the price of the asset may deflate. Yet many households have already spent any gains they have made from their housing assets as they are continually told house prices only go up and hence there must be little risk.
Hence a good part of all the unrealised or artificial housing capital gains have flowed into the economy and helped drive (or overdrive) consumption. The excess consumption of households spending beyond their means helped to bolster the domestic and global economies.
Closer to home, the extra retail spending required extra shop assistants. The cuppa chino and newspaper before work supported the café, just like the eating out at restaurants supported the chiefs and waiters. The kitchen and bathroom renovations required extra tradespeople and well you get the picture.
Further abroad, the spending on the latest consumer gadget or flat screen telly did wonders for the Chinese economy, and as that boomed, they brought our resources to build factories and homes.
We now have a considerable problem on our hands. Not only do we have to cut back on spending and live with in our means, we also have to start paying down some of this mountain of debt we have in our names. For every dollar a household spends in paying down debt, is one more dollar not spent in the economy supporting jobs. It’s a double whammy.
The journey ahead – 2009 onwards
The journey ahead still remains cloudy thanks partly to interference from governments.
The housing market remains the key to the problem. The longer house prices remain artificially high in comparison to household incomes, the more households will need to spend on this expense, and hence the less money that can be spent on other goods and services underpinning domestic jobs.
The quicker we can get house asset prices versus household income back to historic trend, the quicker this crisis will pass, freeing up important money to be spent as discretionary spending.
Many OECD countries have the same problem than us. As you can see from the real house price graphs featured earlier, the U.S. housing bubble has popped and U.S. house asset prices are 27% down from the peak of the bubble. The sooner prices get back to a healthy trend, the quicker they can move into recovery and get back on their feet.
Time to pick and choose: Housing or Jobs
In Australia, our Government is playing a game of tug of war.
One aspect of the economic security package has seen the introduction of the First Home Owners Boost (FHOB), an incentive to encourage first home buyers into the market by giving them extra grants on top of the existing first home buyers grants. If you build a new house, first home buyers get an extra $14,000. If purchasing an existing home, it is $7,000.
If you want to measure the success of this package by the number of First Home Owners signing up, then it’s one thing that Real Estate Agents don’t need to lie about – there is a subprime frenzy out there as buyers, some of which are bidding up prices more than the grant is worth, just so they don’t miss out.
But economically, how is propping up the housing market helping our recovery? Are we just delaying the inevitable, while at the same time encouraging a new generation of home buyers into so much debt, they won’t be ready to stimulate the economy for another 25 years until they pay down the mountain and have some free money left over? This off course assumes they make it through the 25 years, and don’t default once the cash rate starts to head north, requiring yet another bail out from the Government.
To me, this seems to be encouraging our old ways. Have we not learned anything since this crisis has started?
Then we have the $900 handouts. Of the money that is not going to overseas visitors, deceased estates or the dog and cat benefactors of deceased estates, it appear to be going straight into paying down debt. If this helps just one or two households avoid foreclosure, then I certainly wouldn’t mark the package unsuccessful. In fact, just to see the net savings ratio spike up, I think is a huge success.
But at the end of the day, we appear to have two policies – on one side of the rope we have the stripping large sums of money from retail and service sectors by encouraging young first home buyers into a life of excessive debt in a bid to keep the housing bubble afloat, while on the other side of the rope is trying to put money back into the economy with the aim to save jobs.
With news out today suggesting retail jobs which employ 15% of the workforce is under threat from the next stage of this crisis, It is time the government needs to decide what is important: High house asset prices or jobs?
The economy can’t sustain both.
Outstanding – great blog
Well done. But in answer to your question, they’ll go for housing. Too much vested interested and entrenched corruption for it to go any other way.
An outstanding piece of research, but unfortunately the masses I fear will have to learn the hard way, that’s always been the case. Despite pointing many people I know to this website they still tell me they want to invest in residential housing, seems they don’t understand the meaning of investing…. to actually make a profit.
Great website, keep up the informative work, nothing else like it on the web here in Oz.
I wish house prices would fall but it’s not going to happen. I’m seeing houses sell like hotcakes in Collaroy, Narraweena and all around my area. The FHOG boost and low interest rates is triggering another boom. I fear Sydney prices will go through the roof very soon. Like I say, I wish I could buy a house now (to be honest I wish I had bought 10 years ago) but I guess now I’m priced out forever. I’ll probably keep renting, and just hope that my landlord doesn’t keep putting up the rent. With my wife earning a pittance as a schoolteacher and a young daughter to support, I just don’t see how I can afford to buy any time soon. It’s all the nasty specufestors fault. I hate them. Hate them all. My only consolation is that I can at least commiserate with fellow renters on our little forum and explain to them how unfair it all is! Cheers, Dan.
What about jobs in the building industry ?
It’s already more expensive to build a new house than buy an existing house… are you suggesting we should have lower house prices & pay tradies less ?
It doesn’t appear there is much of a choice. If the government supports the housing bubble, then jobs have to go (as they are doing now). Eventually (probably sooner than we think) unemployment will cause the housing bubble to pop.
Seems like propping up housing is just destined to fail, one way or another. Just have a look at the U.S., U.K, New Zealand, Spain, Ireland, Hong Kong, Southern China, Northern India just to name a few.
Housing or employment is not a trade-off. Traditionally, govts have propped up housing to reduce unemployment. This is the reason it is doing it because it is the engine of the economy. A house = tradies employed, soft furnishing employed, buiding supplies employed, financial/legal transactions employed, govt employees employed (rates, stamp duties, GST). The stream of multiplier employment is arguably much better (shelter, a primary need) than retail employed (discretionary and impulse expenses), although housing also supports it indirectly, eg household fittings, kitchen, lounge and others.
Curbing housing or letting it fall off will create a feeling of wealth detriment and people will clamp down on discretionary expenses, hence damage to the retail sector. Comparing with overseas is well and good but there is a need to allow for the cultural and legal differences, something a line on the graph does not account for.
Excellent article with some great comparative analysis between the USA and Australia housing markets.
But the perfect storm needs 2 extra factor systemic factors that Australia is missing massive “over supply” of housing, this is clearly the case in some regions however in Sydney and Melbourne this is not the case in fact rents in some parts of Sydney have made it cheaper to buy than to rent.
Secondly lending to sub prime or customers that have very low credit worthiness has not been the case in Australia, this has limited local bank exposure bad debt and not lead to a local grid lock of the banking system.
If order for the perfect storm to occur I believe that wide spread cross sector unemployment greater than England and Ireland are expecting to see would need to occur to force
Top Job. I notice some politicians such as Liberal Senator for South Australia, Cory Bernardi calling for it to be scraped.
Check out his blog at
http://www.senatorbernardi.com/2009/03/corys-comment-first-home-buyers-grant.html
The Australian real home price index appears amiss. It seems to show a real increase from 2002-2007 from approximately 150 to 300. Although I do not have access to primary data sources this appears to be well and truly in excess of what has actually occurred
Don, the source of the data for the graph comes from Nigel Stapledon’s paper “Long term housing prices in Australia and some economic perspectives.” You can download the paper here. Nigel is now an economics lecturer at UNSW. Previously he was the Chief Economist for the Westpac Bank.
Broadly speaking I agree with the theme of your article but I find no evidence in the paper to support the spike in prices in your graph from 2002-2007. For example p199 shows Sydney median nominal house prices flat from 2003-2006 at $451,000. This makes it difficult to see how real prices could have spiked so dramatically as is suggested by the graph.
“The housing market remains the key to the problem. The longer house prices remain artificially high in comparison to household incomes, the more households will need to spend on this expense, and hence the less money that can be spent on other goods and services underpinning domestic jobs.”
this scares me. what can possibly be done in the short to medium term?
We should have either placed restrictions on the size of land and houses, or encouraged Australians to move into apartments earlier.
It would have probably made a huge difference. Now we are stuck in a mess that we can’t get out of. it will probably take another 10 years or so for prices to level; if they even do. The U.K is apparently in an even worse position than us.
Australia has always taken pride in its high level of home ownership. I doubt if even 50% of Australians will own their homes in 20-25 years.
charlimi + Francesco,
While valid points, to raise the issue of jobs in the property sector (as equally as important as jobs in the retail sector), I think that the government artifically keeping property prices high doesnt necessarily help the property sector long term.
It has got to a point that the young simply cant afford to buy a house. What this means is that developers stop building them. This is a disaster both economically and socially.
There are 2 ways of dealing with this,:
1. the government to intervene and subsidise first home owners;
2.let the natural forces of the market take control and the prices will eventually fall. This means that while some short term pain is felt, in the longer term demand will rise as the natural buyers (first home owners) can afford to buy and therefore developers start building again etc.
It does Australia no good whatsoever for our cost of living to be so high. This ultimately has the affect of making us uncompetitive on the global markets to produce anything apart for where we have an outrageous competitive advantage (commodities).
Ultimately this will substantially reduce our standard of living.
Lucky Bob,
You mention two ways of dealing with this, and the first one that you offer involves more government interference. Hopefully we’ve all learnt by now that central planning doesn’t work. We need to step back, chop off the tentacles of Big Government, and let the market sort it out. I recommend that we remove the subsidies, remove the stamp duty deterrent (what a rort that is), remove the council zoning restrictions and let people subdivide their backyard for a profit if they choose to. This will allow land onto the market at a cheaper price for first home buyers to re-enter at a significantly smaller price.
We are heading the same way as the US. Athough we don’t have a surplus of housing, unemployment will bring the housing crashing down by 40%, as predicted by S. Keen (Economist). I want to know when the govt is going to stop immigration while we are in recession. $110,000 people a year – where will they be housed, how will they get a job and how can we afford to pay them free handouts? CUT IMMIGRATION NOW and save what economy we have left for really Aussies. Also, the extra people puts more pressure on our dams and we don’t have the water.
I run an accounting firm. It is scarey to see clients who have been given loans by banks that are such as high percentage of their income, they have to live off their credit cards. And dont start me on the credit cards. To see people who have more than a years salary outstanding on credit cards, who have fixed salary jobs in education, health care and government – with little or no chance of their incomes rising, is disturbing. Australians are living in a fantasy land thinking our housing prices are reasonable and our banks are responsibile. When banks lend upto 85% of a disposal income for housing, they are completely crazy.
We only have two choices to go forward. Start investing in Education and Business, and pay off our debt now before our lenders work out we are at a tipping point.
You cant borrow your way out of debt – and a nation cant borrow its way into wealth via consumption spending.
This is a great nation with amazing potential to do profitable business with our neighbouring countries and have a great lifestyle for all our people. Lets not throw our wealth and potential away via debt housing deflation.
Fantastic analysis… I’d love to see the UK market referenced here too, especially in some of the graphs.