
Interest rates are considered the primary driver of house prices in Australia. Extremely high dwelling prices means prices are capped by how much buyers can borrow, rather than fundamentals that would underpin a more functional market. As the cash rate has decreased, so has mortgage rates, allowing buyers to pay more for essentially the same quality dwelling.
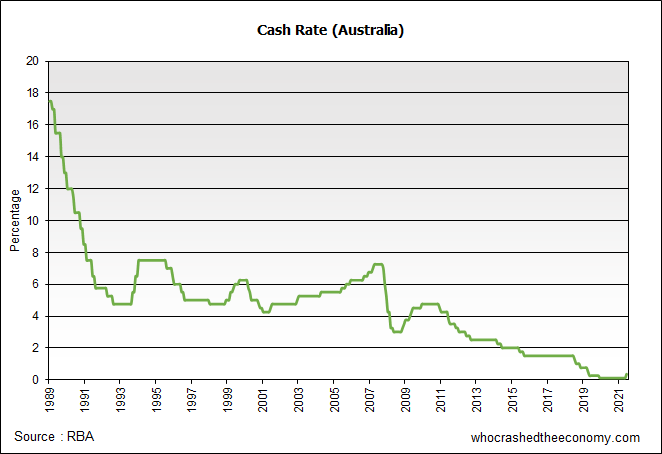
The Coronavirus pandemic has seen the Reserve Bank of Australia, like other central banks, dramatically slash interest rates and implement quantitative easing programs to support the economy. In addition, Government’s have turned to fiscal measures, and all this ultra-cheap money looking for goods and services at a time when supply chains are breaking down due to the pandemic, has created a surge of inflation.
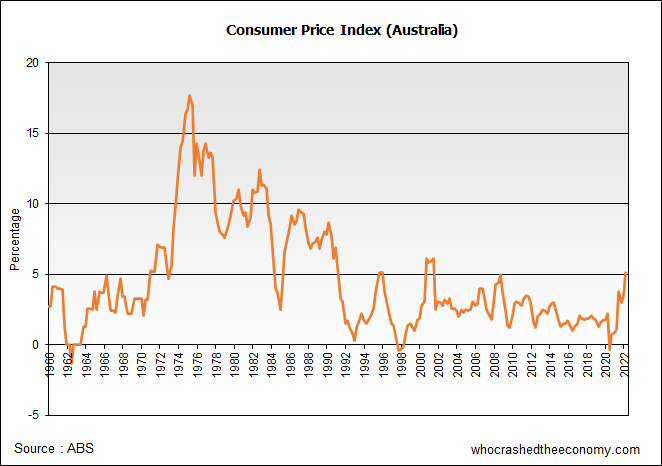
For the March 2022 quarter, the Consumer Price index hit a high of 5.1 percent. The bout of inflation around the 2001 period was caused by the introduction of the Goods and Services Tax (GST). If you argue, this was an artificial, known event, then Australia hasn’t seen inflation this high since the 1990s.
The Reserve Bank of Australia has a mandate to keep inflation within a band of 2 to 3 percent. Hence, this high inflation has now prompted a rate hike. The Reserve Bank hiked the cash rate from 0.1 percent, 25 basis points to 0.35 percent.
The last RBA rate increase was on the 3rd November 2010, some 11 years ago. For 1.1 million Australian mortgage holders, this is their first rate rise.

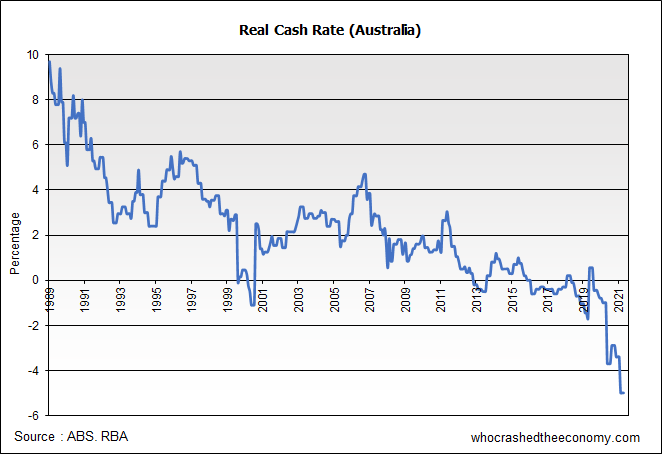
Historically, the cash rate has always been higher than consumer price inflation, but as the graph below shows, this has lead to a extremely low real-cash rate. (Real means corrected for inflation). Deposits held in the back is losing purchasing power.
Historic Lending Rates – 1960 to present
It’s hard to believe so many Australian’s are experiencing mortgage stress today, when interest rates are at historic lows. However, they have borrowed to the hilt on the expectation that house asset prices always rise, and that mortgages rates will always fall.
The following graph puts historic home lending rates into perspective
