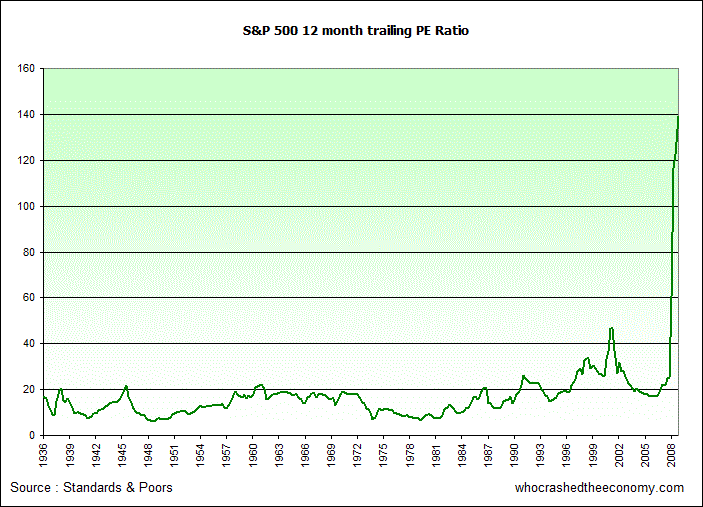
The price earnings ratio or PE is a gauge of a stock’s valuation. The higher the PE ratio the more overvalued a stock or share is.
Below is a chart of the average PE ratio for the S&P500 (an indice of 500 large cap stocks listed on the NYSE and the NASDAQ). Generally the PE ratio floats between 15 and 20.
In the lead up to the Great Depression in 1929, the PE ratio for peaked around 32. During tech wreck, a period where tech companies experienced dizzy share prices and actually had no earnings, the PE ratio peaked around 46.

Today, the PE ratio is 141. In the past months we have seen earnings fall through the floor, yet share prices have rallied in the opposite direction, only exaggerating the PE. (The dictionary definition of exaggerate is to “magnify beyond the limits of truth”)
This begs the question of when this irrational exuberance will end?
Next Wednesday, J.P. Morgan Chase will kick of the third quarter bank reporting season. While bank stocks have surged in the third quarter, there is concern about earnings that may be more negative than many investors expect.
“Third-quarter earnings for most banks, particularly the regional lenders, will be extraordinarily negative,” Richard Bove, an analyst at Rochdale Securities said. He expects 60% of banks will report losses.
“None of this bodes well for the third quarter,” Bove said. “Once the market is faced with the reality of how bad the earnings are, it will be interesting to see whether investors will be able to hold on to these stocks at these price levels.”
» October surprise from bank earnings? Some experts worry results may be much more negative than investors expect – Market Watch – 10th October 2009.

Will be interesting to see what happens when the stock markets need to rethink future earning potential. I wonder if we will see a repeat of last year’s meltdown? The US dollar at 0.5% interest has presumably had time to become the basis for a massive global carry trade. If the underlying assets melt down, then people will be selling their shirts to settle US dollar debt. Maybe the US dollar will get another “last gasp” – a real long term recovery seems a bit unlikely!
Yes – a US dollar spike and synchronous selloff in all other assets a la 2008. I’d give it a 50% chance. If this unfolds watch the RBA cut to 2% or less overnight..
I think you need to reference your source for 141 PE. This seems inordinately out of line with estimates that I have seen elsewhere
When looking at this story relating to the US market it is important to remember that the local market here has not suffered the same unchecked rise, in fact most of our best listed companies are still sitting around a PE of less than 20, only the smaller caps have any greater than this. On top of this is the fact that Australian listed companies pay more generous dividends due to their monopolistic sheltered environment, here in Oz competition is not so cut-throat as in the US.
The only Oz companies to fail over here recently were those who were simply managed recklessly rather than due to the GFC. For the time being Oz still can dig stuff out of the ground and ship it off to China, this can’t last forever and when we no longer any resources to sell it will be interesting if a nation of “houses” and little else can actually remain functional and productive. Meanwhile good’ol Ken Henry wants to tax the nation harder…… and that includes removal of the capital gains exemption on the family home, oh how that will start to affect house prices if it happens! and also wants the introduction of a wealth tax…. the latter which only exists in a minority of countries around the world and has caused an out-flow of capital in those countries.